
Decoding Curves: A Game Developer's Insight into Bézier Magic
Ever wondered how the curve making Pen Tool works its magic? Unravel the simplicity behind the seemingly complex mathematics — a revelation so clear that a 10-year old can grasp it with ease. I'm here to guide you through this journey like never before, revealing the clear simplicity behind the secrets of curves, no sleepless nights required. So, go ahead, grab a pen and paper, and let's unlock the art of creating curves together – it's simpler than you think!
Updated: Dec 8, 2023
Published: Dec 8, 2023
Unveiling the Mystery: My Journey into Understanding Curves
I was creating a game for the annual js13kgames competition in 2023, and decided to create a game to cut objects. As most people these days, I asked my friend ChatGPT to help me, and it went surprisingly well in the beginning. But that was about to change. I wanted to try some cool things such as splitting the object exactly where I dragged my finger. I spent countless nights trying to get the code to work, but it was all futile. That's why I decided to actually sit down and learn the math behind it, which helped me understand curves and lines so much better. I was also able to accomplish what I wanted in my game, which you can play here if you're curious.
The secret to curves are actually straight forward. A curve is created using several straight (short) lines. The straight lines are just so short that you don't notice where it start and ends. I'll walk you through the math behind it, and how computers are able to draw the smoothest curves. The curves made from the Pen Tool in applications such as Illustrator, Gimp, or my personal favorite, Affinity Designer, are called Bézier curves, but we'll refer to them as curves in this blog post.
Now, let's dive into the fascinating world of curves and discover the math behind them. Having some images and animations to go with the explanation will make it easier to understand.
The Simple Math Magic of the Pen Tool Unveiled
In the below video, I'm using the Pen Tool to create a curve. Everyone who's worked with vector graphics are probably used to working with the tool.

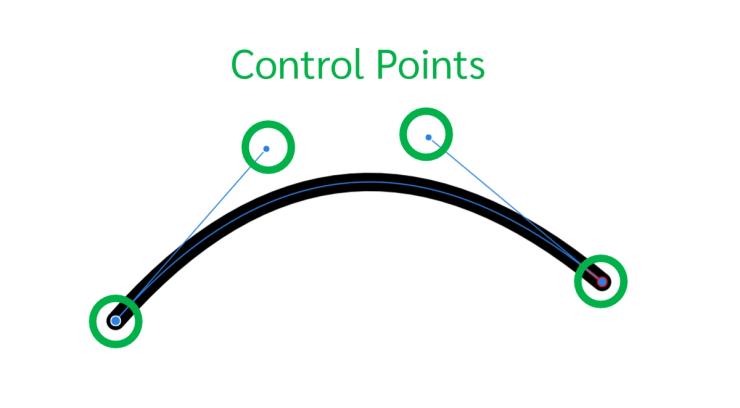
The important thing to notice are the invisible points that help shape the curve. These are called control points. A curve can consist of multiple control points, but the most common curves have four points, also referred to as a cubic Bézier curve.
The computer screen consists of a grid with pixels, each with it's own coordinates (x, and y,) and the computer can only draw a straight line from one coordinate to another, there's no curvature in a straight line. When these points are close enough, and displayed on a high resolution screen, the lines will form a curve.
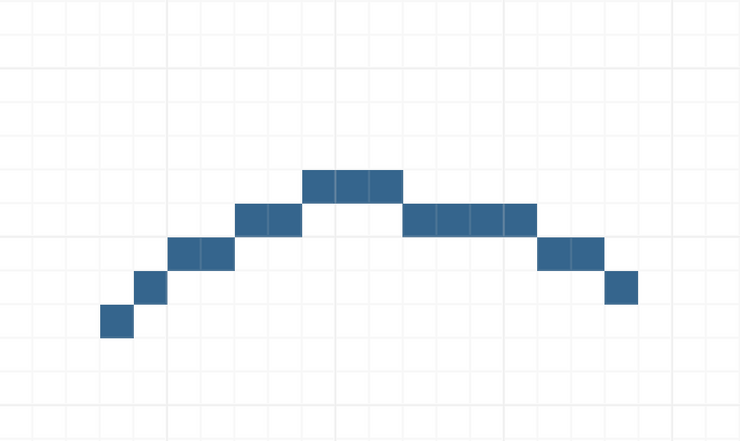
Here's how a curve would look like in low resolution. Can you imagine where the lines start and end with this image? Each pixel we see can be a line (where the start point and end point are the same,)
Let's see how a curve would look like in high resolution.

So smooth.

Then, how does a computer know where to draw these straight lines when all we have are 4 control points? The secret behind the Pen Tool is easier than what you think. I will go through the math, I know math sounds scary, but trust me, if you know how to add, subtract, divide, and multiply, it should be fairly straight forward to follow along. I will include some exercises as well, where you are the computer, and you have to draw a curve by hand, using only four control points. Grab some paper, a ruler and a pencil, and join me in this exercise.
Finding the points on the curve
Before I walk you through the math, I want to show what we will be doing.
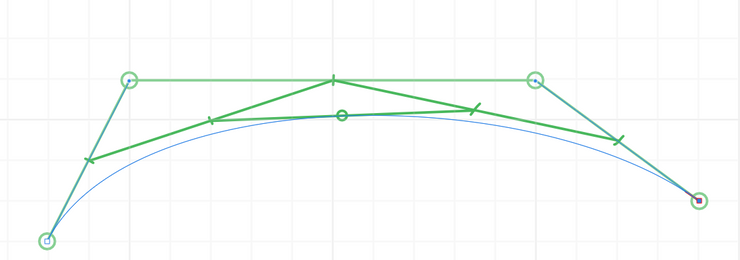
In the video we start with 4 control points, the green circles. Then we will
- Draw a line between each point.
- Mark the center point of each line (50% mark on the line)
- Draw (green) lines between the new points
- Mark the 50% point on the lines
- Draw a line from the new points
- Circle the 50% mark of the last line
We repeat the above steps two more times, but instead of marking the center point, we draw the 25% mark and 75% mark instead.
This approach is actually called the De Casteljau's algorithm. If we look up this algorithm online, we'll be overwhelmed with a lot of math, symbols and graphs, which will scare even the bravest of us. It took several days to build up the courage to go through it myself. But fret not, It's not complicated if we break it down. Let's try to add some numbers to the approach we did above.
Each point is represented as a tuple with x and y coordinates. The x-coordinate is along the horizontal line, and the y-coordinate is along the vertical line. For the first point, the coordinates are 3,2 (x = 3, y = 2).
Here's a video of the steps to calculate the center point.
In the video, we do the following:
- Subtract the coordinates of point 2 and point 1
- 5,6 - 3,2 = 2,4
- Multiply with 0.5
- 2,4 * 0.5 = 1,2
- Add point 1 to the result above
- 3,2 + 1,2 = 4.4 (let's call it s1)
- Subtract the coordinates of point 3 and point 2
- 15,6 - 5,6 = 10,0
- Multiply with 0.5
- 5,0 * 0.5 = 5,0
- Add point 2 to the result above
- 5,6 + 5.0 = 10,6 (let's call it s2)
- Subtract the coordinates of point 4 and point 3
- 19,3 - 15,6 = 4,-3
- Multiply with 0.5
- 4,-3 * 0.5 = 2,-1.5
- Add point 3 to the result above
- 15,6 + 2,-1.5 = 17,4.5 (let's call it s3)
- Subtract the coordinates of point s2, and s1
- 10,6 - 4,4 = 6,2
- Multiply with 0.5
- 6,2 * 0.5 = 3,1
- Add point s1 to the result above
- 4,4 + 3,1 = 7,5 (let's call it s4)
- Subtract the coordinates of point s3, and s2
- 17,4.5 - 10,6 = 7,-1.5
- Multiply with 0.5
- 7,-1.5 * 0.5 = 3.5,-0.75
- Add point s2 to the result above
- 10,6 + 3.5,-0.75 = 13.5,5.25 (let's call it s5)
- Subtract the coordinates of point s5, and s4
- 13.5,5.25 - 7,5 = 6.5,0.25
- Multiply with 0.5
- 6.5,0.25* 0.5 = 3.25, 0.125
- Add point s3 to the result above
- 7,5 + 3.25,-1.375 = 10.25, 5.125 (let's call it s6)
I know these calculations may feel overwhelming, but it's easier to follow along with the video above. Take one and one line at the time, and you should have no problem doing the math on your own. These calculations help us find a point, s6, on our curve. This point is guaranteed to be on the curve.
With less than 10 segments, we'll be able to create a series a lines along our curve. Using the same control points, but replacing the multiplication part of 0.5 with 0.1, 0.2, 0.3, ...., 0.9, we'll get 9 coordinates along the curve. Drawing a straight line from each point will form our curve. Add more segments for an even smoother curve.
This is the secret behind the Pen Tool, and that's how a computer draws a curve. I've made an interactive example, where you can change the number of segments, and also drag the control points around.
Experience the magic firsthand! Explore the complete example on my CodePen or experiment with the live interactive demo at the end of this blog post.
Need clarification or have questions? Reach out to me by sending a message through my Contact Form. I'm happy to help.
I'm also thinking about recording a video of myself going through the steps manually, and explaining everything. If this is something that sounds useful, please let me know.
Exercises
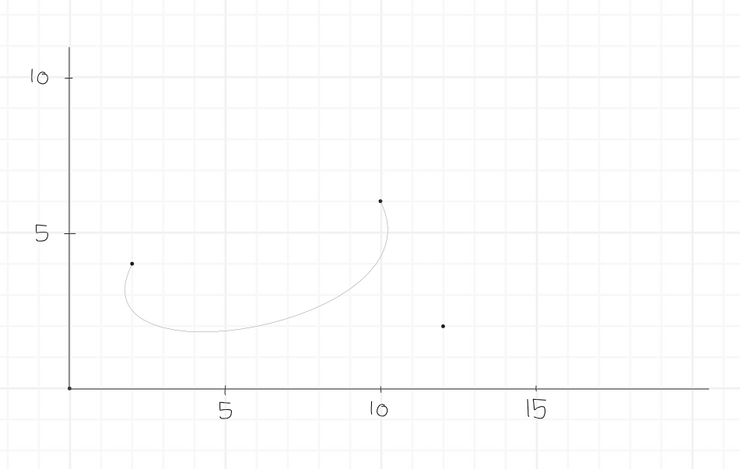
As promised, I've included a few exercises. To guide you in mastering curve calculations, I've illustrated the actual curve in each exercise. Use them as visual aids to validate your calculations. I also recommend checking out the live example in the bottom of this blog post to understand how the curve will look like depending on the number of segments.
The first exercise has these control points:
- p1 = 4,2
- p2 = 4,6
- p3 = 16,10
- p4 = 16,6

The second exercise has these control points:
- p1 = 2,4
- p2 = 0,0
- p3 = 12,2
- p4 = 10,6
The coordinates doesn't have to be all positive. Here's a slightly more tricky exercise:
- p1 = 2,-4
- p2 = 6,-8
- p3 = 7,-1
- p4 = 11,-2

Final words
We've unveiled the secrets of drawing curves through a series of connected straight lines. We calculate points on the curve and seamlessly draw straight lines between them. With this knowledge, you can conquer challenges in game development, just as I did with Samurai Sam. I hope it wasn't too difficult.
If you enjoyed this post, I think you'll like another post related to this topic. I created a game for the js13kgames 2023 game jam, called Samurai Sam. It's a game where you slice objects with your sword (finger/mouse.) The game uses techniques I've outlined in this blog post to slice the objects, and here's the Post Mortem: Slicing with Samurai Sam, a js13kgames entry.
If you liked this blog post, or want me to elaborate on other topics, consider sharing this post and follow me on Twitter (𝕏) @ReitGames. Subscribe to my weekly newsletter for more posts about game development. Happy coding!
The example below uses the same approach I've outlined in this blog post. Try to drag the control points around, and adjust the number of segments.